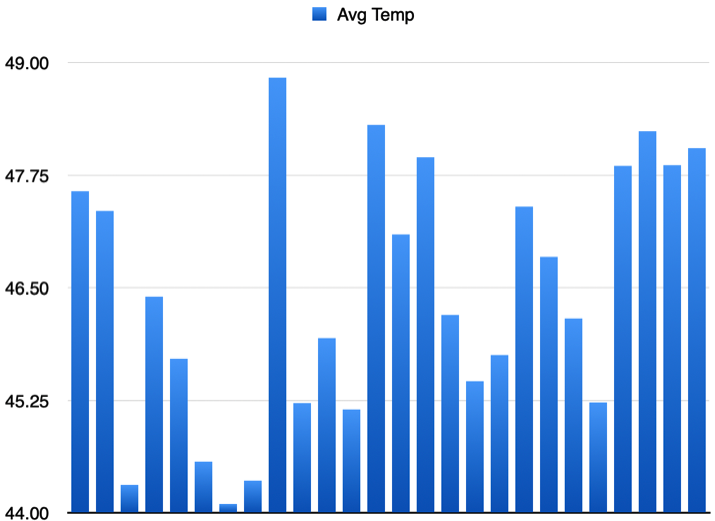
The chart above shows what made my stomach drop when I glanced at the data. I quickly looked to see how the year stood in relation to the others. Noticed the last few were all 47.8° or higher. So I looked to see how that compared. In 26 years there are seven years 47.8° or higher, four of them are the last four years.
This is one of the things that lines up with pretty much all the climate specialists in a panic during the later half of 2023.
One thing I have noted, even among those freaking out is several are moving to talking points saying we are making progress in the fight. I do not see how they can say this when fossil fuel production has regained almost all (or more) of the usage decline during Covid slowdown in 2023. The 2023 data has not been released yet but smaller daily usage data shows demand gain was strong in 2022 and 2023 addd to that. Most energy agencies project 2024 will continue to add to the increase.
So the positive talking points are probably due to many with honest appraisals at the edge of giving up. I get the not throwing in the towel idea but be honest about it. Say what WILL happen with one path and would could happen with other choices. I knew the 1.5°c target set in Paris was ignorant because the ingredients were already in the oven. News coverage must focus on what will happen at 1.7°, 2.0° etc.
Local note from Maine is there was at least three floods in 2023 then the record high tides in January 2024. Climate forecast for Maine was warmer and wetter. I did not think the coast would see much before 2050. Failed to realize that like yearly data the moves are not linear but sudden events/spikes happen. It was like not seeing the trees through the forest.
Moving on to the precipitation chart...
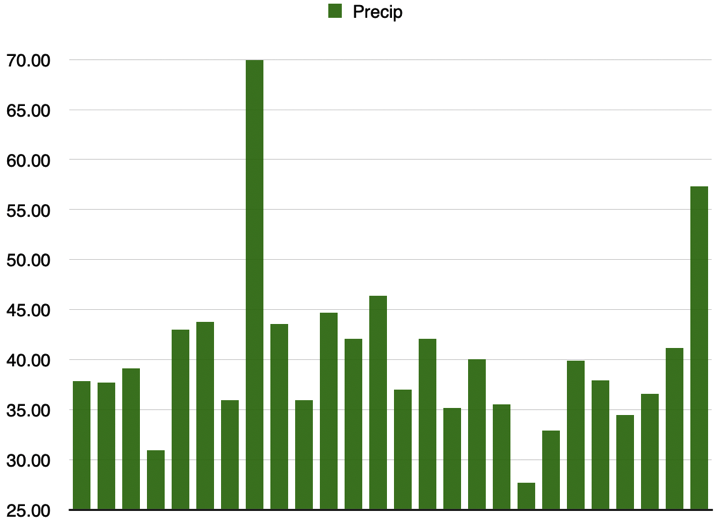
The precipitation trend looks to be falling until 2023. May look at monthly trends but what has been falling is snowfall. The second decade showed a large jump in yearly snowfall. 2018 is in the third decade but the last above average snowfall season was 2017-18. However this cannot be the major reason as seen in December 2023 which had more rain than snow. Wondering if weather station is being impacted by tree growth near the location. Plans to install a second weather station in the Spring solely for wind and rain measurements. The location is completely wrong for temperature readings (also impacts humidity and dewpoint) but would not be as shielded by trees for wind and rain.
The top year, 2005, was mostly due to major rain in October and November. Even removing almost 9" received in December this year would still be in second place by about 2" over 2010.
98 99 00 01 02 03 04 05 06 07 08 09 10 11 12 13 14 15 16 17 18 19 20 21 22 23
98 99 00 01 02 03 04 05 06 07 08 09 10 11 12 13 14 15 16 17 18 19 20 21 22 23